Losmandy and McLennan gearbox comparison using the Ruland coupler


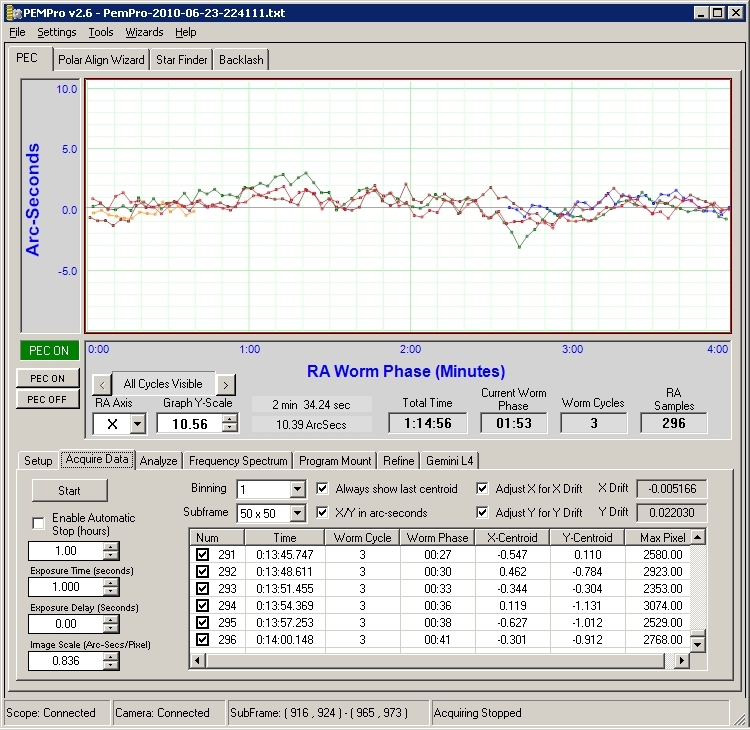
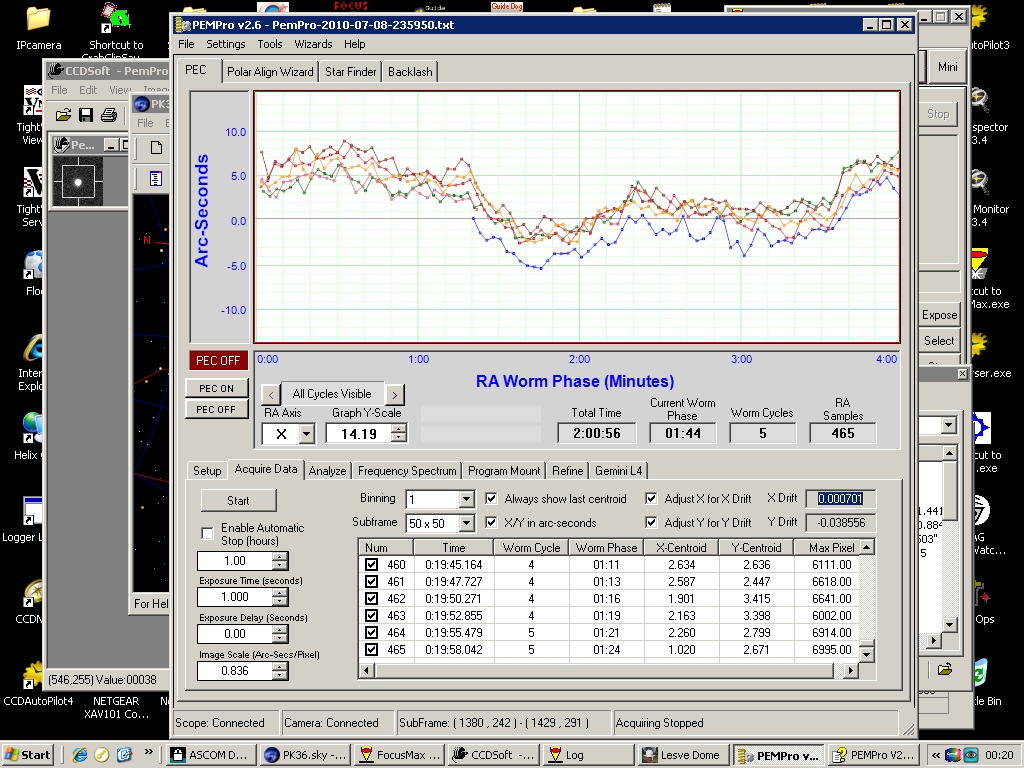
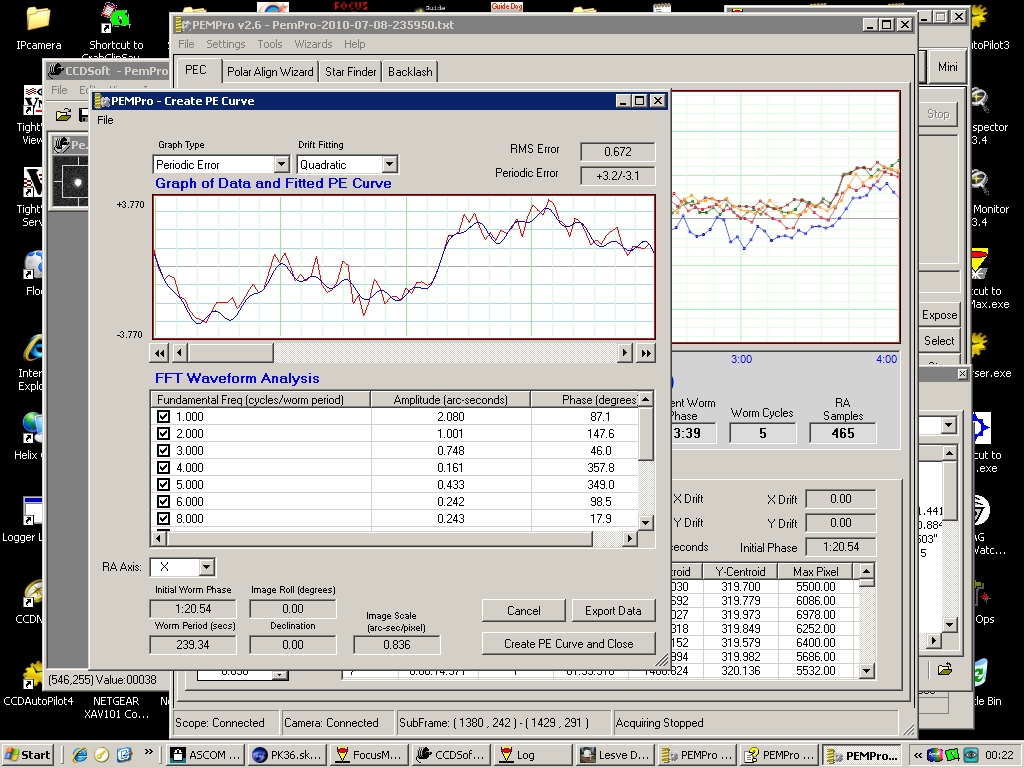
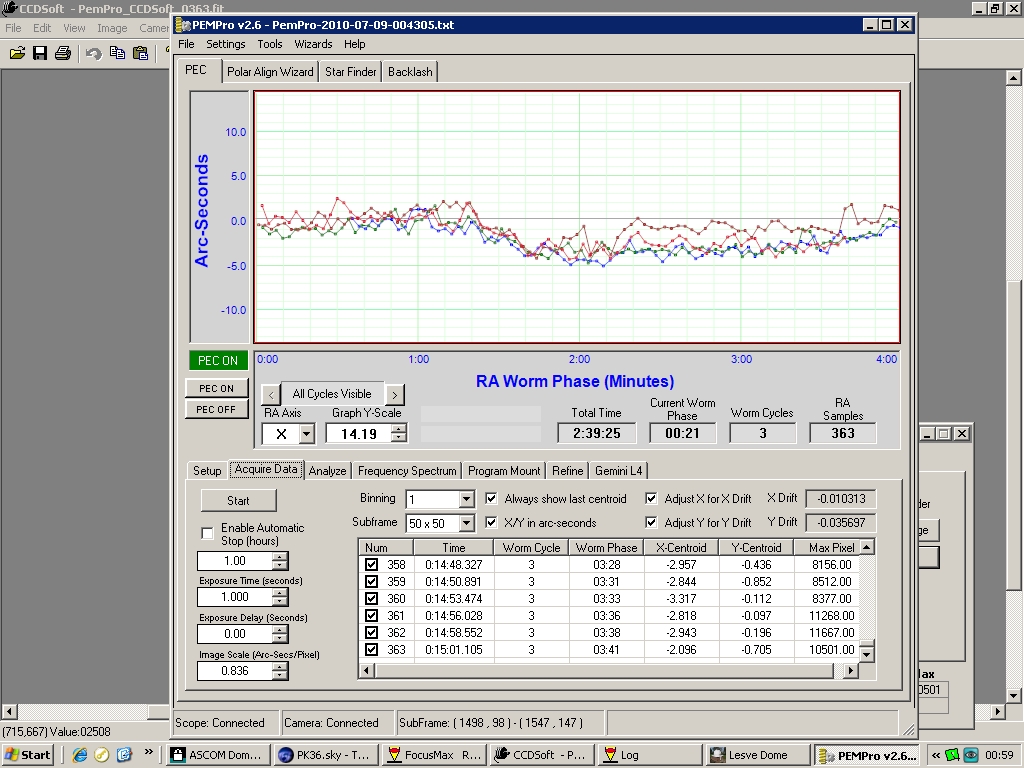
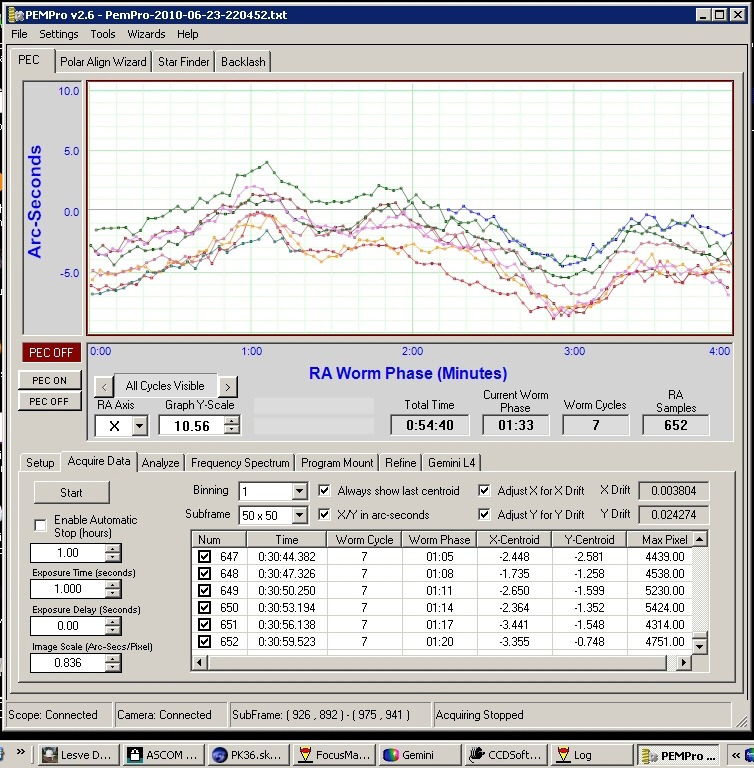
   Test series of the original Losmandy Gemini gearbox and the high precision McLennan gearbox using the Ruland coupler. PemPro V2 was used to measure PE, generate PEC and plot the performance results.

This series of tests include:


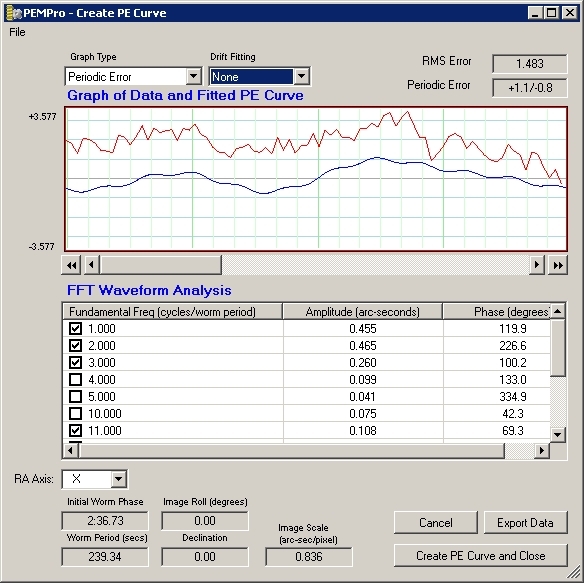
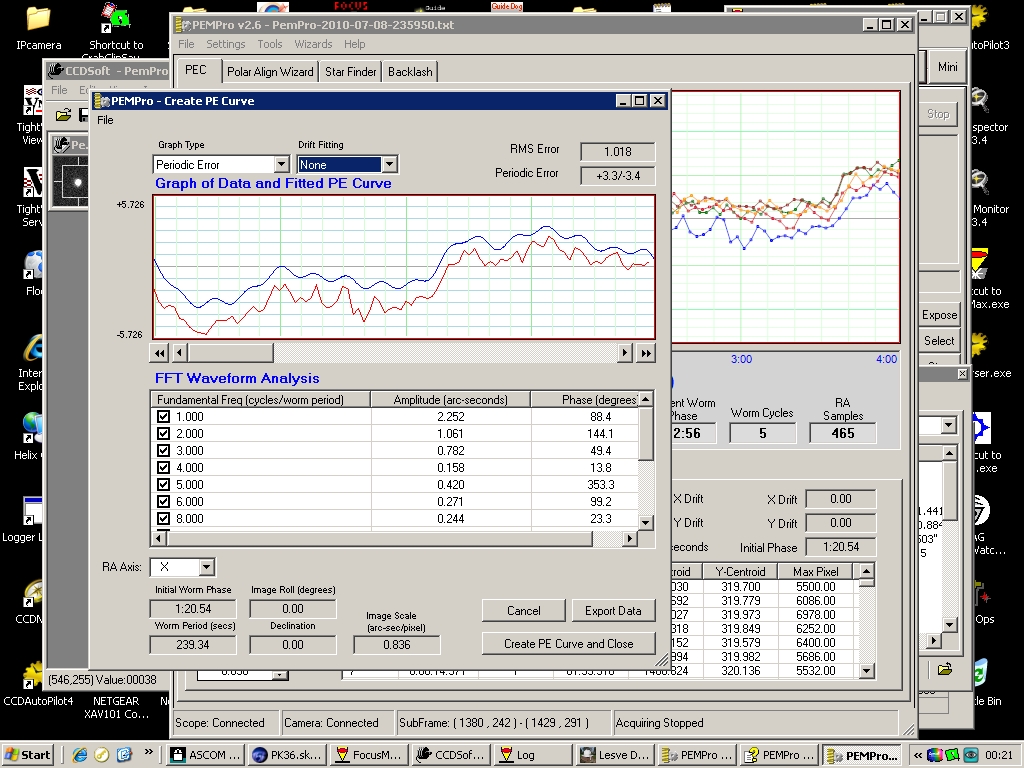
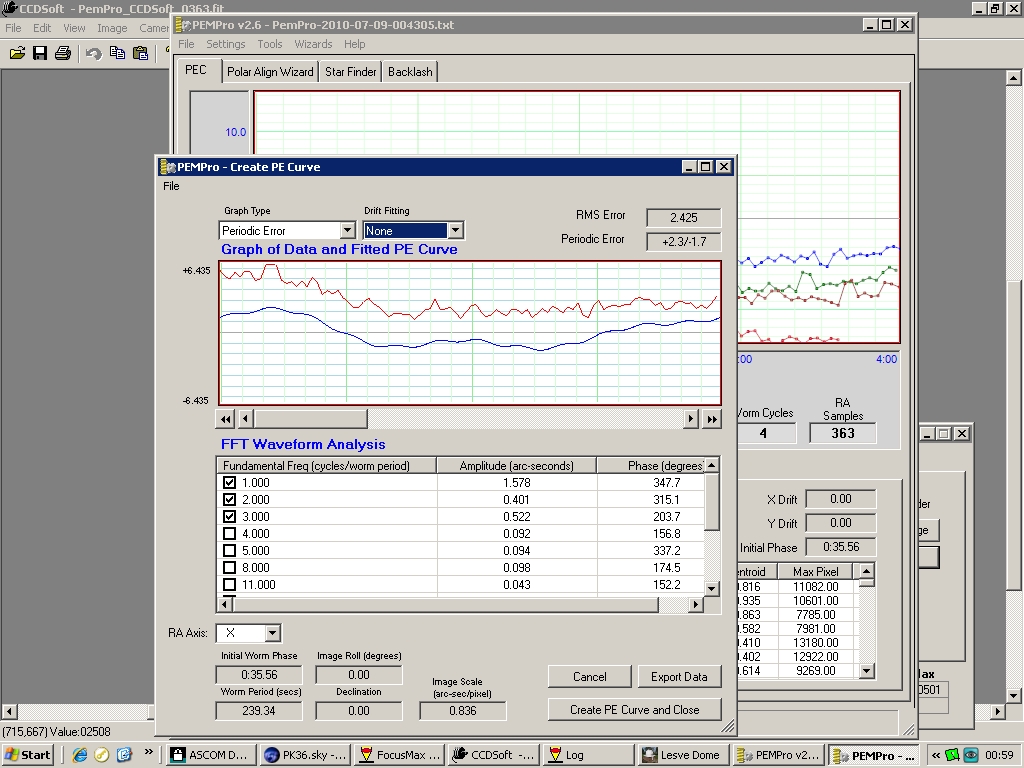
Note: PemPro does allows you to fine tune the PEC profile by adjusting drift and delays. I've included drift fitting screen shots to show 'none' and the best fit for comparisons.

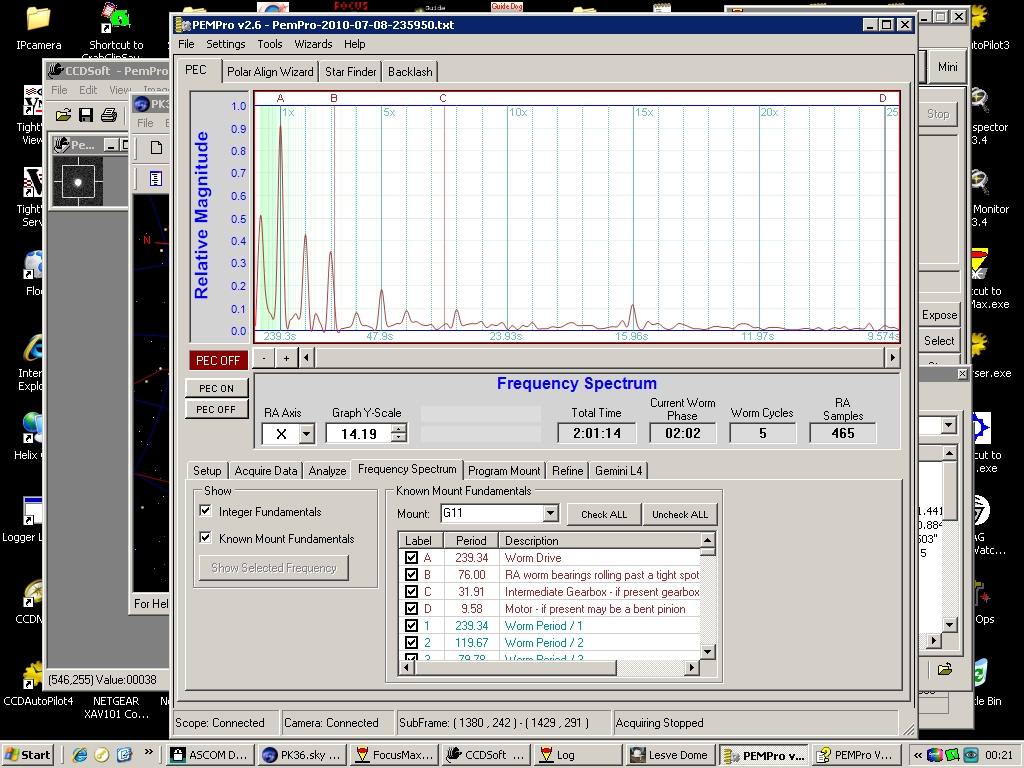
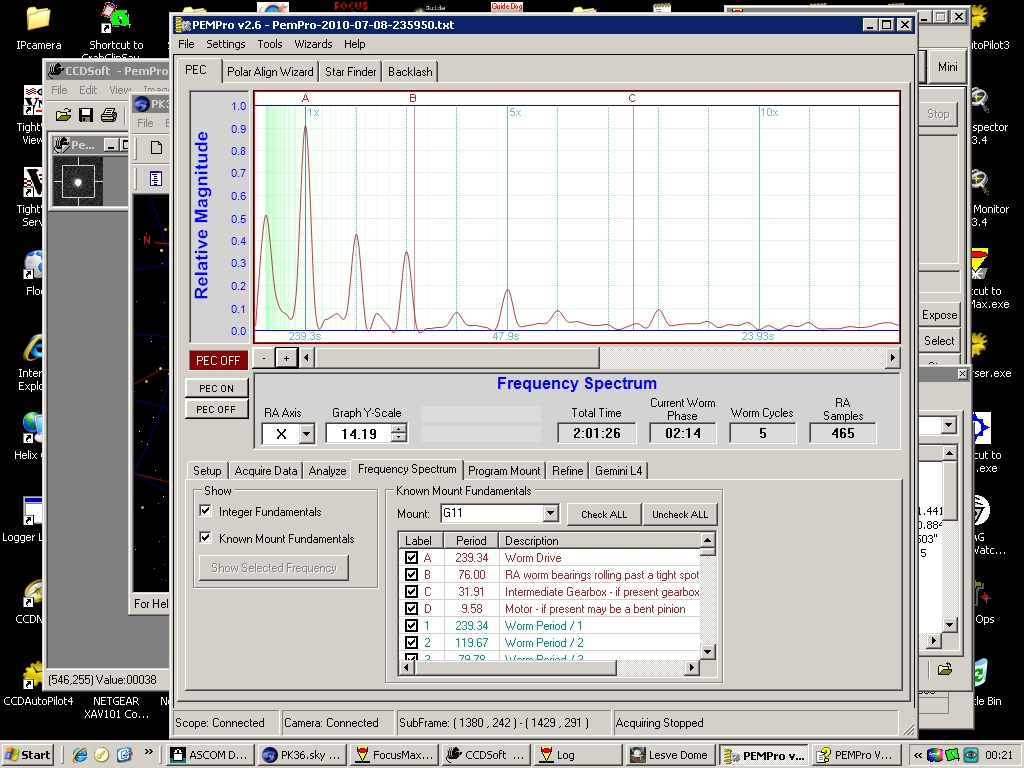
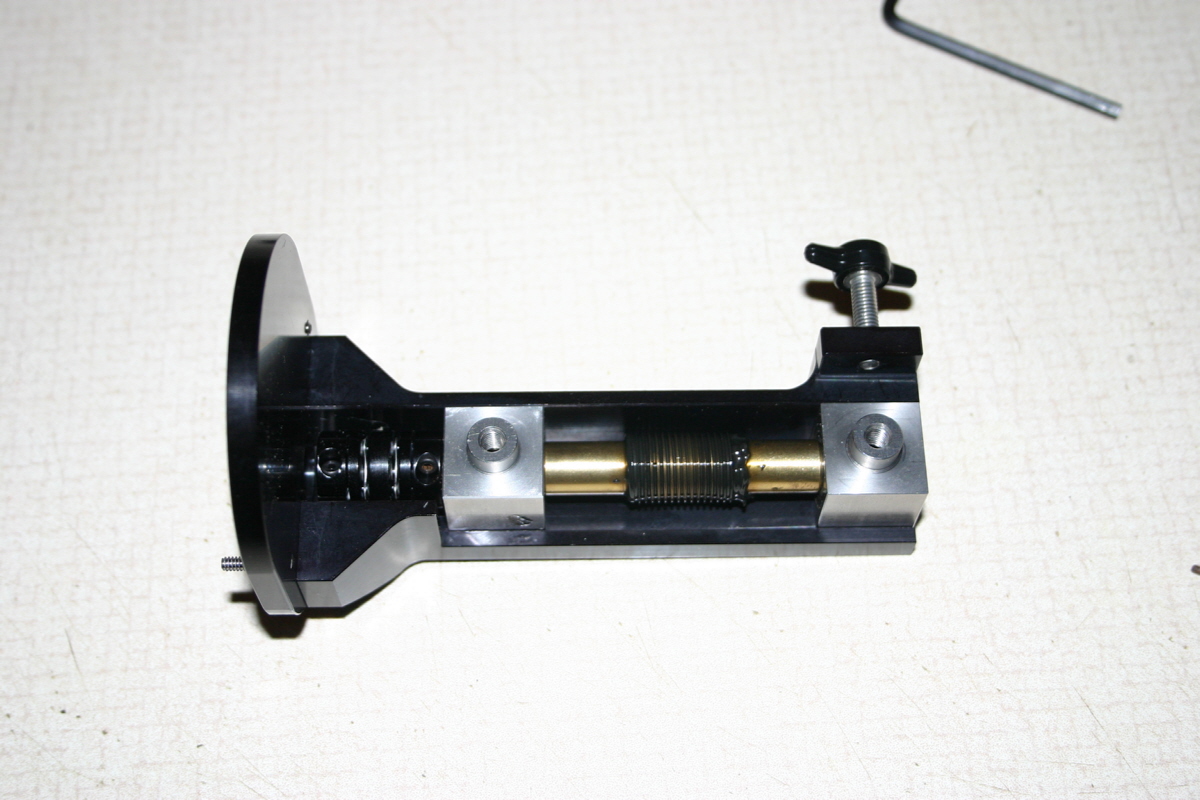
Ruland coupler with Losmandy Gemini stock gear box tests
(Clicking on the images will open a larger version to better see the details)

Ruland disk coupler mounted on RA worm Seven passes of data collection were taken using the stock Gemini gearbox with Ruland coupler.
A graph displaying the frequency spectrum.
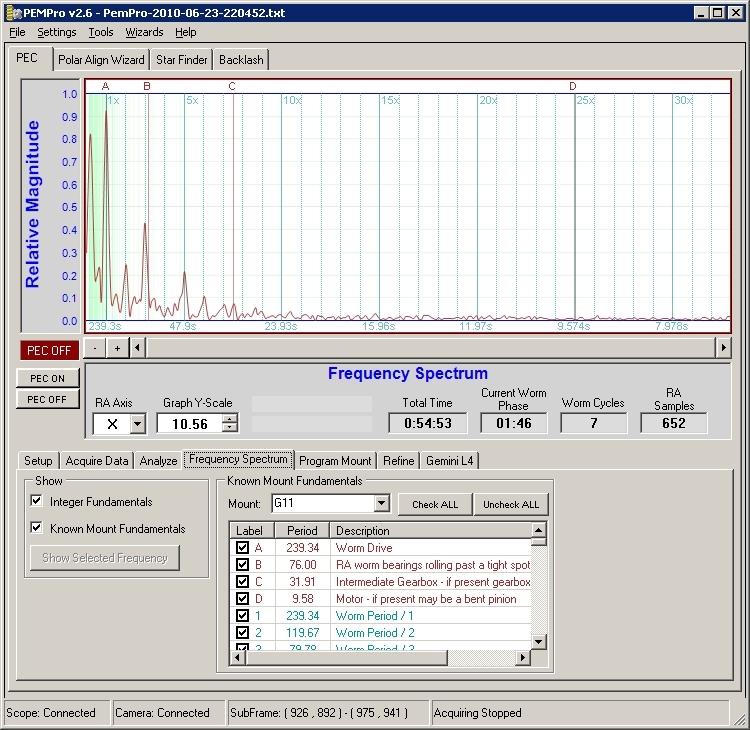
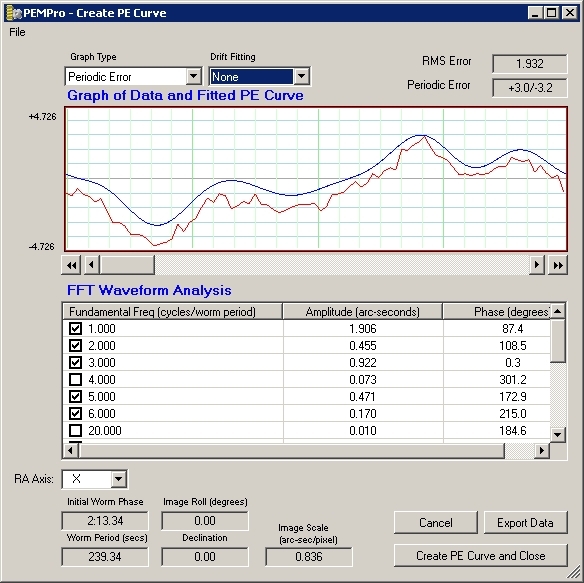
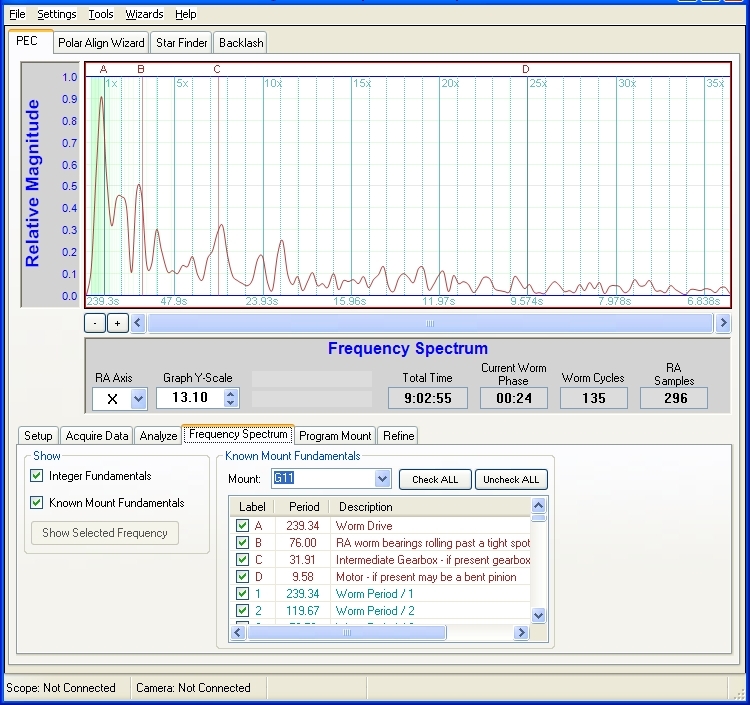
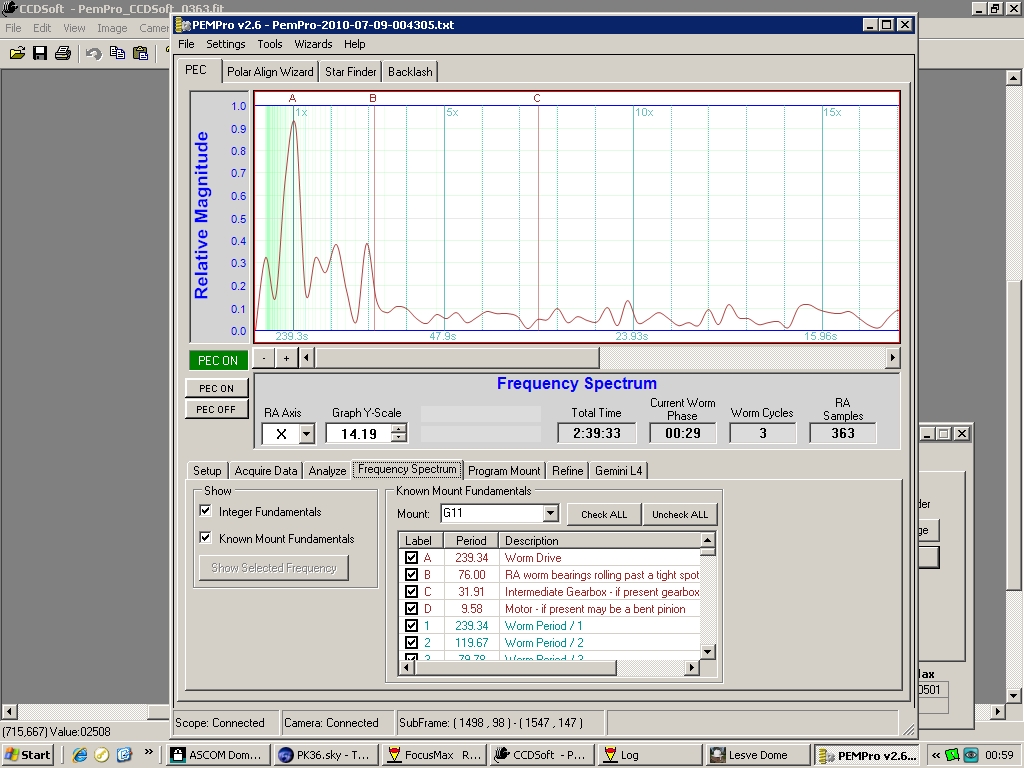
Note the .11 arc second gearbox noise at mount fundamental C which is the focal point of this test.
Drift fitting set to 'none' to show uncorrected PE


Performance with PEC enabled

   Before uploading, the PEC profile was modified with a -0.5 sec delay to offset file download and processing times. This setting was found by changing the delay and repeated testing to achieve the best star RMS profile as measured in CCDSoft as well as visual.
Afterwards 3 cycles of data were taken followed by a 4 minute (1 worm cycle) unguided exposure with PEC enabled.

With the new PEC profile uploaded and enabled, 3 worm cycles were measured using PemPro and the results displayed. Frequency graph showing fundamental 'C' still present. Because this .16 arc second peak doesn't occur on a fundamental frequency it can not be removed with PEC programming.
Drift fitting set to 'none' to show the uncorrected PE with PEC enabled. Putting numbers aside I want to see the visual results. Shown here is an unguided 4 minute image with PEC enabled taken at 1856 mm F/L. Using the cursor information tab in CCDSoft a stars RMS profile between x & y can be measured. Ideally this should be the same for both axis.


Ruland coupler with McLennan high precision gear box tests


Five passes of data collection were taken and analyzed. The spectrum plot shows the fundamental at 'C' has been completely eliminated.
A zoomed in view showing the gearbox noise at 'C' has been eliminated. Drift fitting set to 'none' to show the uncorrected PE.
The PEC curve with a fitting applied.


Performance with PEC enabled
  Before uploading, the PEC profile was modified with a -0.5 sec delay to offset file download and processing times. This setting was found by changing the delay and repeated testing to achieve the best star RMS profile as measured in CCDSoft as well as visual.

Another 3 passes with PEC enabled. Frequency spectrum shows the gearbox noise at 'C' still eliminated. Worm PE at frequency 1 and 76 error (now 80 second) at 3 remain though very low. To the right is seeing noise.
PE curve not fitted. This curve wasn't added to the mount's PEC table but is only a reference of what is remaining. Aside from the peak at fundamental frequency 1 which can be guided out further, the remainder are at the limits of my local seeing conditions. Shown here is an unguided 4 minute image with PEC enabled taken at 1856 mm F/L. Using the cursor information tab in CCDSoft a stars RMS profile between x & y can be measured. Ideally this should be the same for both axis. Not bad for a 4 minute unguided image.

Summary
  The uncorrected PE results from both gearboxes were similar but the McLennan unit clearly eliminated the gearbox noise at fundamental 'C'. Though this was at a low level (.11 - .16 arc seconds) every little counts when working with low numbers so eliminating outside error contributions from other extraneous sources other than the RA worm helps. This peak also didn't occur on a repeatable fundamental so PEC programming will not remove it.

© 2010 Michael A. Siniscalchi